Owners meetings at MLS must be slightly odd affairs, compared to most other leagues around the world. In the soccer world you have a steady turnover of clubs due to promotion and relegation, so that typically 10-20% of your membership is new each season. With the US major leagues there has been significant expansion over the last 50 years, but they have looked pretty stable for a while now. By contrast, MLS had 12 teams in 2006 and now has 23, so in little over decade the membership has almost doubled. One wonders how the newbies interact with the old guard.
What made me think of this was looking at the attendance figures. These may be subject to some artificial inflation in aggregate (see @EmptySeatsMLS) but they should be useful to make some comparisons across teams. It should go without saying that this is not gospel, but in the heated world surrounding discussion of all things MLS it bears repeating.
When looking at attendance a perennial debate is whether you should look at the aggregate figures or the average per team. In the European context where the number of teams in each league is stable, I have argued for the aggregate over the average, since this gives you an indication of the overall popularity of the game (the Bundesliga has a higher average than the EPL but a lower aggregate).
The same applies to MLS I think, although averages are also useful if we want to compare subgroups within the league. So the first figure shows the aggregate attendance at MLS, which has risen from about 3 million in 2005 to over 8 million in 2017, a compound annual growth rate of over 8%, which is pretty impressive. MLS has ridden the wave of the growing popularity of the sport in the US, of which there are many other indicators, notably the proliferation of soccer on TV. I know people think I never have a good thing to say about the league, but there you are: I think this growth is impressive.
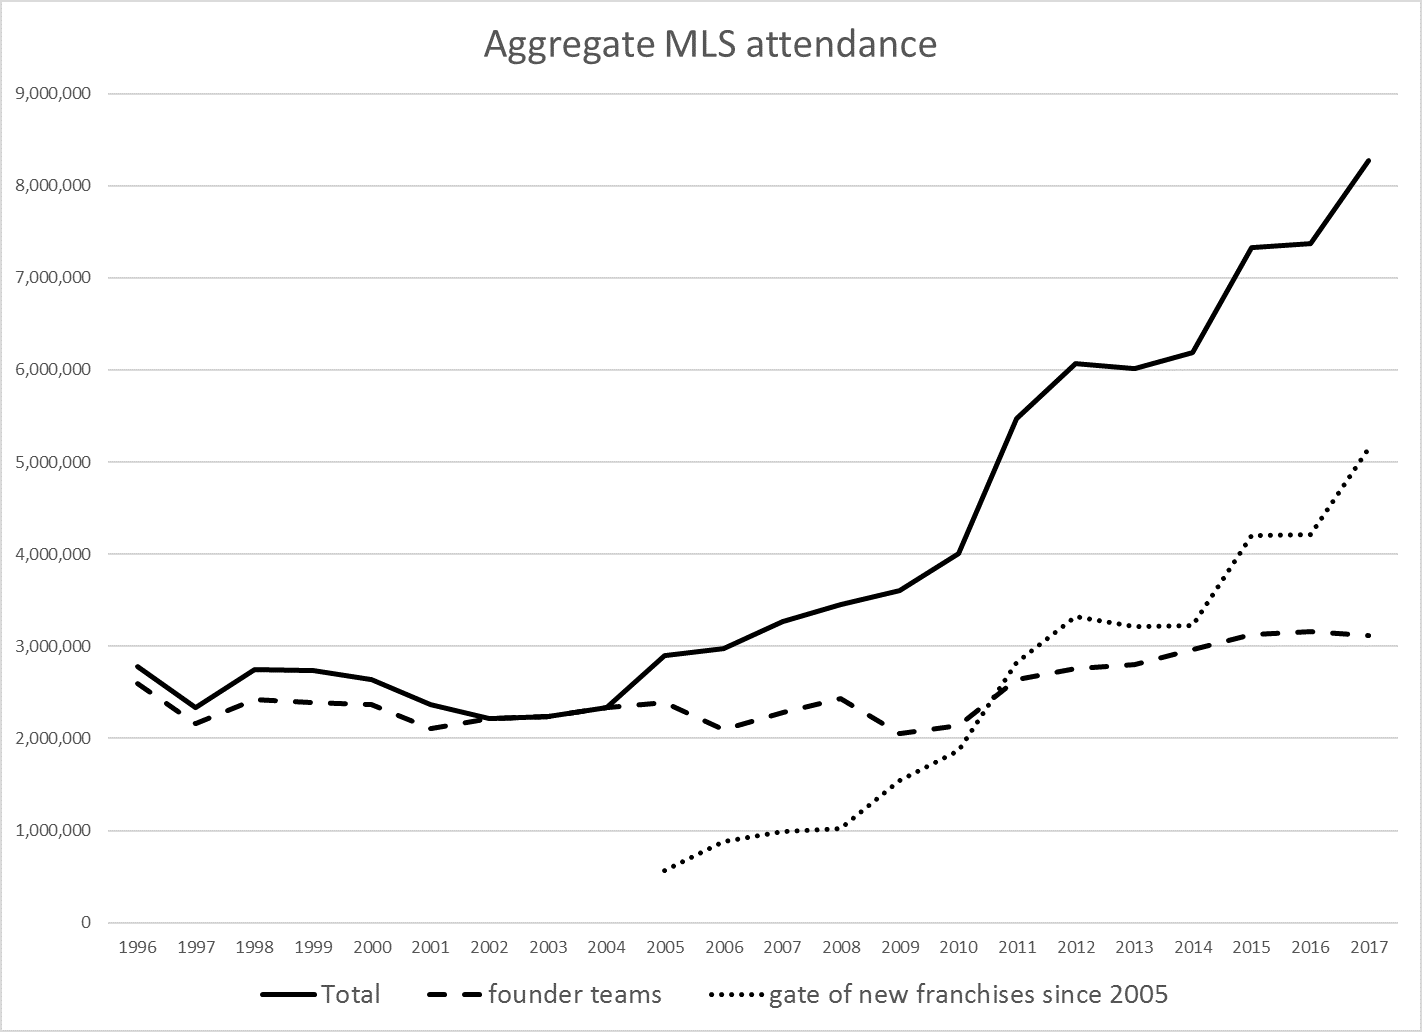
Now, ten of the founder teams survive today, and the charts compare attendance at the founder teams to to attendance at the new franchises. What this shows is that almost all of the extra attendance has come from the new franchises. Well, maybe that’s not so surprising, but there’s also evidence that a rising tide has raised all boats. Since the expansion began attendance at the founder franchises rose at just under 3% per year.
However, just think for a moment about those owners meetings – the new franchises now account for approaching two thirds of the total, even though they make up only half of the room. There must be some interesting differences of view between the old and the new.
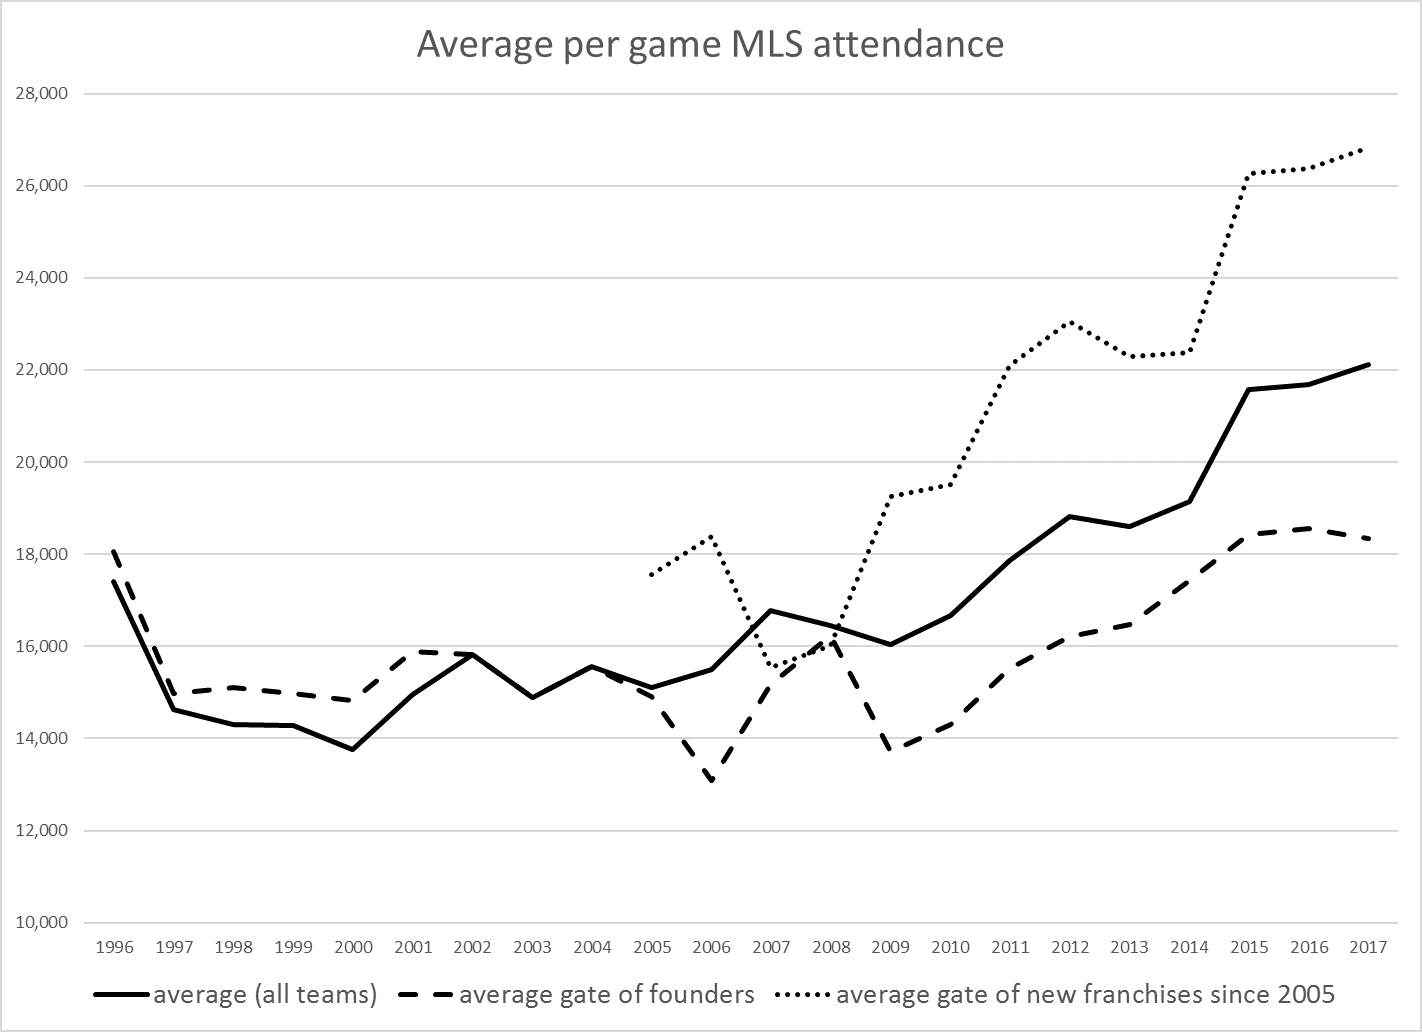
Not only do the new guard make up a bigger share of the total, they also have average higher gates and their gates are growing faster than those of the old guard. Moreover, since getting a bump from the 2014 World Cup, the average of founder teams has been essentially flat.
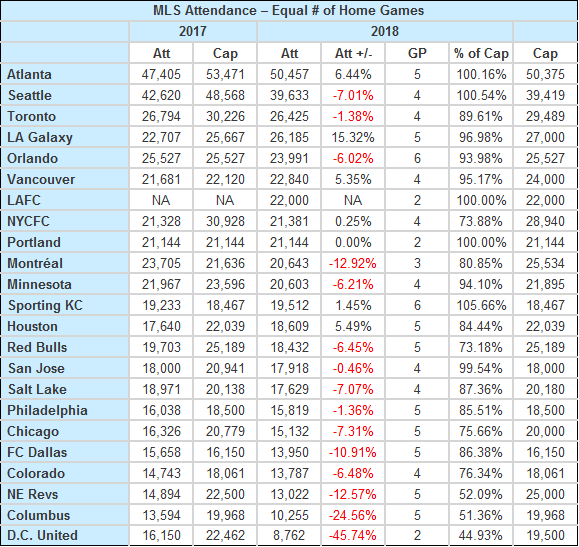
This is nicely illustrated on the excellent Take Me Out To The Ball Game website which posts weekly updates on attendance at MLS comparing this year to the same point last year. Below I’ve coped the most recent table (posted May 7, 2018). It shows the same pattern as last year. The MLS average is stable, but most teams are reporting lower attendance, and most of those teams are founder teams. Those meetings must be interesting.