
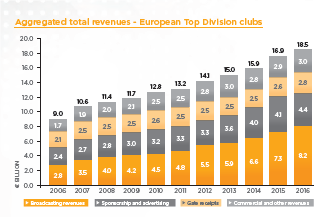
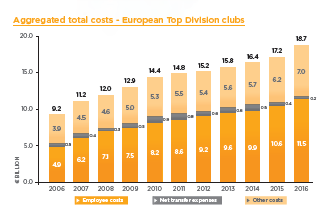
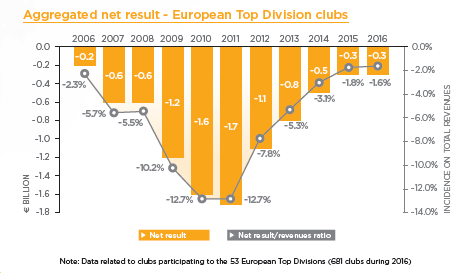
The 2018 Report Calcio provides some nice summary charts about European club finances, which in turn are based on the annual (ish) UEFA Club Licensing Benchmarking Reports. The data refers to the clubs in the top division of each of the UEFA member associations (just over 700). The three tables below illustrate the trends in overall revenues, costs and profits (net result) between 2006 and 2016. What is striking about the profit chart is the way in which losses increase and then decrease over the period.
There’s been a lot of talk, often encouraged by UEFA, suggesting that improving club finances are attributable to the success of Financial Fair Play (FFP) in holding back “excessive” spending by clubs. For example , this from UEFA
“UEFA has released its ninth club licensing benchmarking report on European club football – highlighting how UEFA’s Financial Fair Play regulations have created a more stable and sustainable financial position for European top-division clubs.”
Long term there may be indeed be an effect on wages if FFP is effectively enforced, as Thomas Peeters and I argued in our 2014 article. But since then there’s been some questions about willingness of UEFA to discipline the big clubs among questions about legal enforceability.
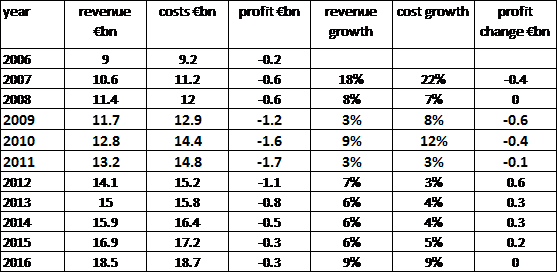
But the data here suggests a much simpler pattern. This is clearer if we convert the data into a table and compare annual growth percentages as is done in the table below.
The financial crisis of 2008 triggered the biggest recession of the global economy since the Great Depression of the 1930s. Sports in general and football in particular are often less exposed to recessions than other businesses, especially in the modern era when they tend to rely on multi-year broadcast contracts. But they are not immune.
The biggest impact of the recession would have been felt in the years immediately following 2008. The three years 2009-2011, highlighted in the table, were the three years of greatest reported losses in the period. The combined losses in these three years were greater than the combined losses in the other eight years.
Recessions create problems for businesses because revenue growth stalls while the cost base can be hard to control. Falling revenue growth could be attributed to lower attendance, ticket price reductions, reduced merchandise sales, difficulty in renewing sponsorship contracts and lower terms for broadcast rights if negotiated during the recession.
The difference between the three year recession period and the other years is summarized in the second table. It shows that between 2009 and 2011, revenue growth fell to 5.1% per year, compared to an average of 8.6% per year, while cost growth was almost identical in the two periods.

This is a very simple and intuitive story. Football experienced the recession in similar fashion to almost any other business. When not in recession revenue growth is very slightly higher than cost growth, when in a recession it is lower. Over the long term, revenues are always slightly less than costs.
There is no role for FFP in this story. Of course, that will not stop people saying that there is. But then, they probably won’t be looking too closely at the data.


