Back in April, just after the league was shut down, I generated a simple forecast of the outcomes of the remaining EPL – posted here. So now here the actual final table to compare.
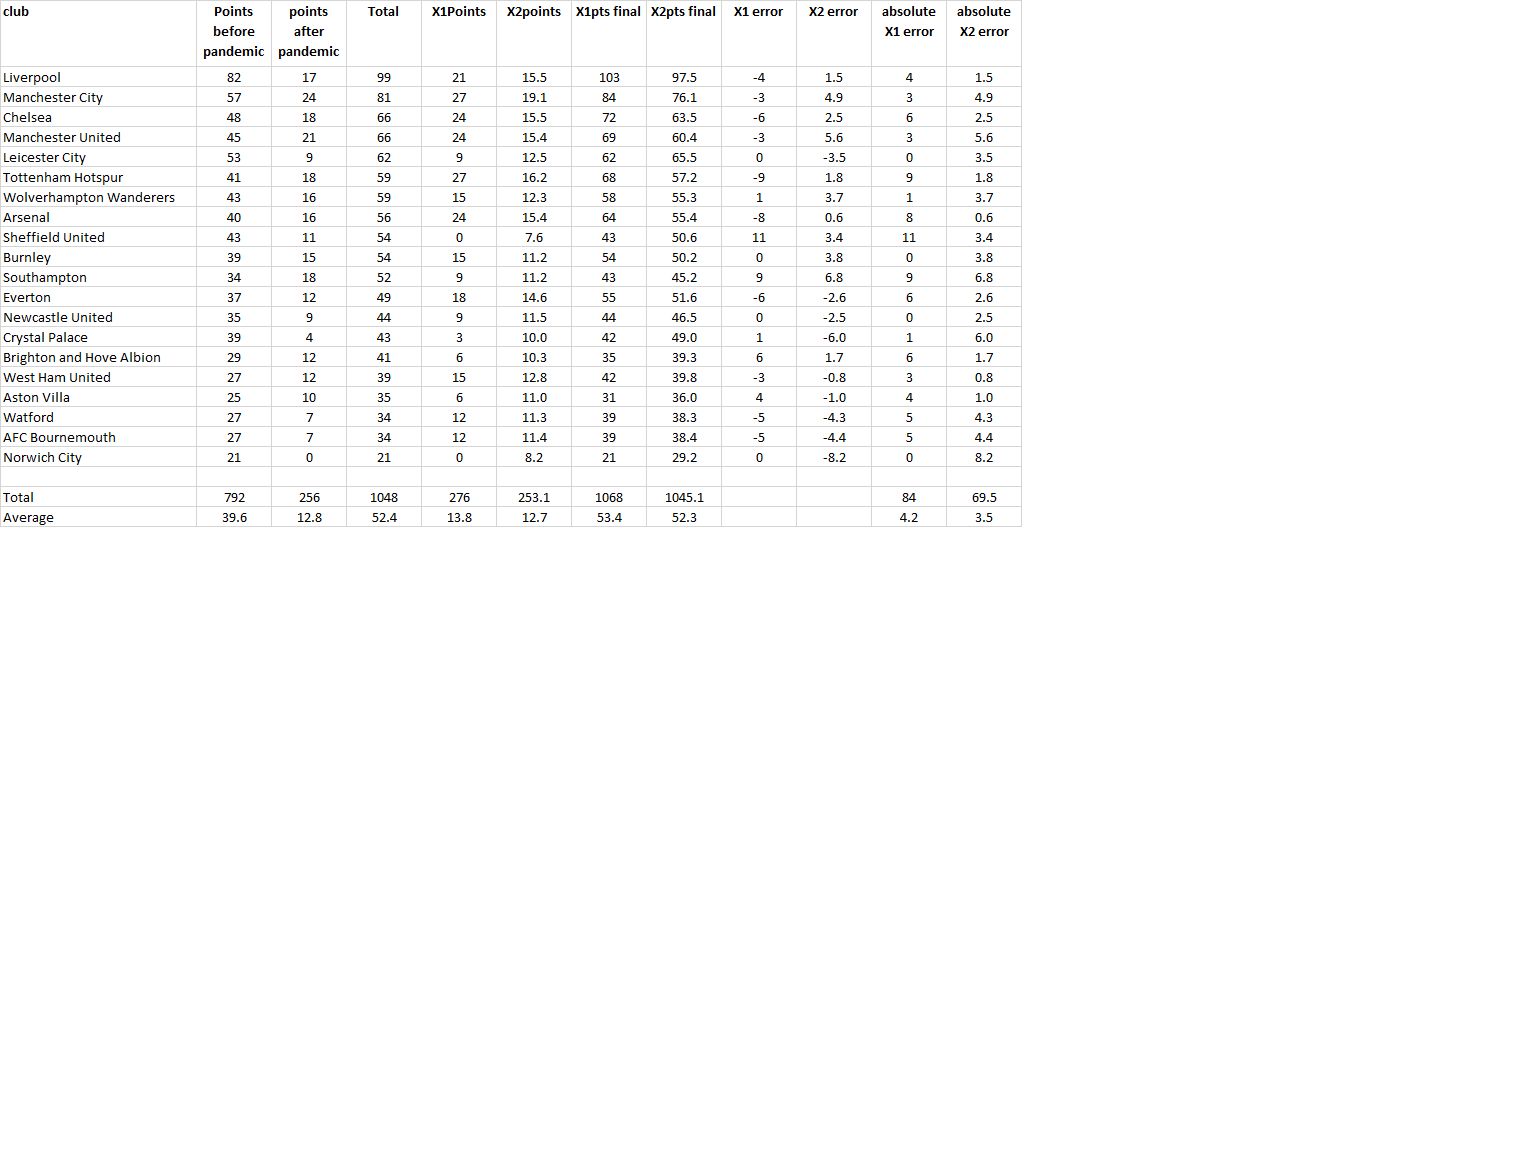
I actually generated two predictions the X1 forecast were based on predicting the probability of each possible outcome for each game, and then assuming that the points were awarded on the basis of the event with the highest probability. X2 was generated by assuming that points were proportional to the probabilities themselves, and then adding all these probabilities to generate the expected points (probably a better way to do it).
How close were the forecasts. The X2 values were the closest, with an average absolute error of 3.5 points per team. Over the 8 or 9 games left this is not bad. I’ve not done the calculation, but I’m fairly sure that this is very close to the bookmakers predictions. The X2 values had a an average absolute error of 4.2 points.
The biggest error in the X2 model came in the relegation zone, with Aston Villa and Brighton predicted to go down, when in fact Bournemouth and Watford, who were in the relegation positions in March, both suffering the drop. As someone pointed out at the time, the model was failing to take account of form across the season. This would in factc be easy to factor into the prediction model.
The point I wanted to make is that the model based on only two values- the TM value estimates from transfermarkt – are sufficient to generate forecasts that are reasonably accurate, as measured against bookmaker predictions. This example seems to bear this out.