
UEFA announced today that they are cool with pretty much any way of determining the end of season placings relevant for UEFA competition qualification, so long as this condition is met: “the procedure for selecting clubs should be based on objective, transparent and non-discriminatory principles.”
Most leagues seem to be hoping that they can play the remaining games, even if behind closed doors, as the Bundesliga is reported to be planning. But if the remaining 92 EPL games cannot be played, what then?
One solution would be to award slots on the basis of league standings at the time the league was suspended. Taking into account Manchester City’s Champions League ban (which the club is contesting in the Court of Arbitration for Sport), the Champions League places would go to Liverpool, Leicester, Chelsea and Manchester United and the Europa League slots to Wolves and Sheffield United. On this basis Bournemouth, Aston Villa and Norwich would be relegated.
Would this be fair? Some clubs had easier end-of-season schedules than others, and this could have affected the rankings significantly. The only way to decide if that is true is to use a forecasting model.
I have previously posted my very simple forecasting model, with data and Python code. The model simply forecasts results based on home advantage and the ratio of team squad values as published by TransferMarkt (TM). Although the model is simple, it’s prediction success rate is very close to the success rate of bookmakers’ odds, and more complex models such as the one produced on the 538 website.
So I decided to use my simple model to forecast what the end of season table would have been. If you want to check this for yourself, here is the Python code (in a zip file) and the datafiles:
Premier League 2019-20 forecast model based on 2011-18 coefficients
Premier League table March 13 2020
EPL games for end of season 19-20 forecasts
The model generates the following Table:
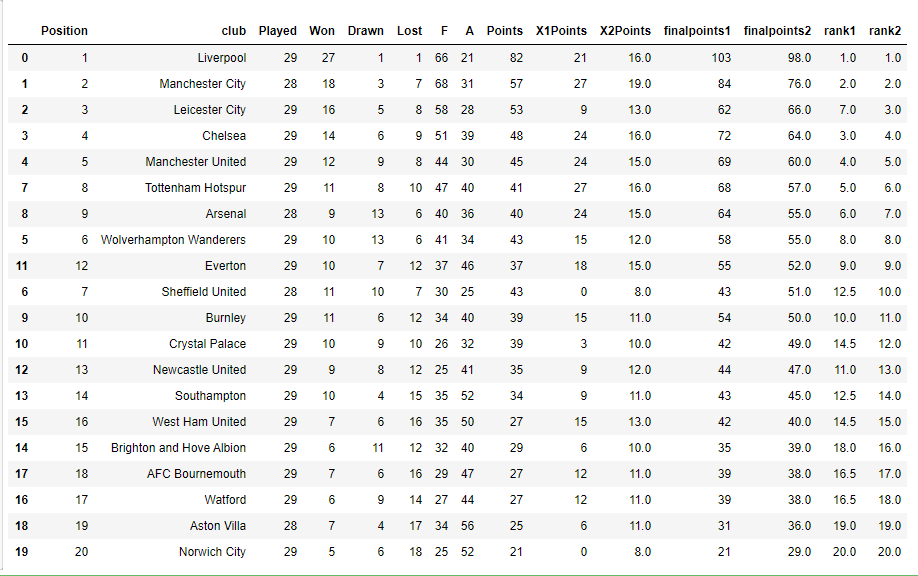

“Position” refers to the actual league position when the season was suspended, while “rank” is the league position forecast by the model. The model only predicts points, not goal difference. These are added to get the final points, and then the teams can be ranked by forecast points to get forecast league positions.
There are two versions:
X1Points, based on the mostly likely winner of each game, based on the probabilities. finalpoints1 = Points (at suspension) + X1Points (forecast), which gives rise to some tied positions.
X2Points, based on the sum of probabilities of winning over the remaining games multiplied by 3 plus the sum of probabilities of a draw. finalpoints2 = Points (at suspension) + X2Points (forecast),
The main change at the top of the table is that Tottenham and Arsenal would both move above Sheffield and Wolves. The only difference between finalspoints1 and finalspoints2 is that with the former Leicester would lose out on Europe as well while based on finalpoints2 they would hold their current league position (3rd).
Perhaps the most interesting result is what happens at the bottom of the Table. Aston Villa and Norwich are still relegated in 19th and 20th place in both models, but Bournemouth escapes in both models. With finalpoints1 Brighton suffers the drop, while with finalpoints2 it is Watford that goes down. Part of the reason lies in the remaining fixtures of the three teams.

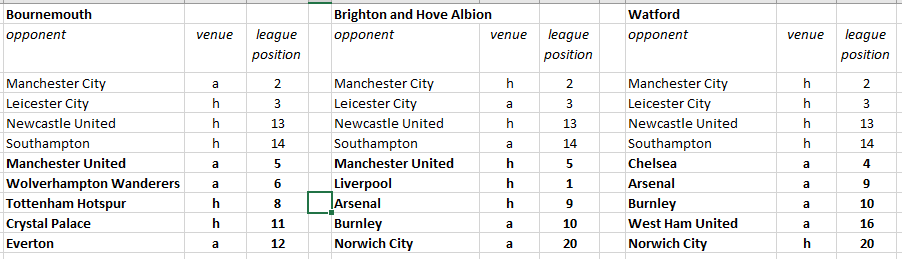
Each has 9 games to play, and 4 are against the same teams. Of the remaining five, Bournemouth’s chances look a little better than either Brighton or Watford. The best chance to gain points is against weaker teams while playing at home, and this gives Bournemouth a slight advantage over Brighton, although the Watford comparison is less clear.
In any case, that’s not the real reason the model favours Bournemouth. The real reason is that the model predicts based on the ratio of TM values, and Bournemouth’s TM value is 50% higher than Brighton’s and 30% larger than Watford’s. That’s also why Tottenham and Arsenal prosper while Wolves and Sheffield (and possibly Leicester) suffer.
Before you say that’s unfair or unreasonable, remember that the model is almost as good at predicting as the bookmakers , and if bookmakers were systematically wrong about the probabilities they would be bankrupt. It may be true that all models are wrong, but I doubt anyone could produce a model which (a) fitted the historical data better and (b) produced a very different outcome. If anything, TM values are likely to play a bigger role in determining outcomes toward the end of the season as injuries start to pile up, given that the richer teams have the deeper benches.
But if anyone has a better model, then i’d be interested to see their data and code 🙂
What this analysis shows is that even if does prove impossible to play the remaining fixtures, sorting who qualifies for Europe and who gets relegated is going to lead to a lot of disputes, and could even end up in court.


